Scabbard is an open-source Gradle plugin and annotation processor that generates visual diagrams of your Dagger dependency graphs. By converting your Dagger setup into easy-to-understand images, Scabbard helps you:
- Quickly identify dependency issues
- Understand complex relationships
- Improve code maintainability
How to Integrate Scabbard in Your Android Project
Follow these steps to set up Scabbard and start visualizing your Dagger dependency graphs:
Step 1: Add Scabbard and Dagger Versions
In your libs.versions.toml file, add the following versions:
scabbard = "0.5.0"
dagger = "2.56.2"

[libraries]
scabbard-processor = { group = "dev.arunkumar", name = "scabbard-processor", version.ref = "scabbard" }
dagger = { group = "com.google.dagger", name = "dagger", version.ref = "dagger" }
dagger-compiler = { group = "com.google.dagger", name = "dagger-compiler", version.ref = "dagger" }

[plugins]
scabbard = { id = "scabbard.gradle", version.ref = "scabbard" }
Step 2: Apply the Scabbard Plugin
In your module-level build.gradle.kts file, apply the Scabbard plugin:
plugins {
    alias(libs.plugins.scabbard)
}
Step 3: Add Dependencies
Add Dagger and Scabbard dependencies to your module’s build.gradle.kts:
implementation(libs.dagger)
kapt(libs.dagger.compiler)
kapt(libs.scabbard.processor)
Step 4: Enable Scabbard
Configure Scabbard in your build.gradle.kts to enable graph generation:
scabbard {
    enabled = true
    failOnError = false
    outputFormat = "png"
}
Step 5: Add JitPack Repository
Scabbard uses dependencies from JitPack. Add JitPack to your repositories in settings.gradle.kts:
dependencyResolutionManagement {
    repositoriesMode.set(RepositoriesMode.FAIL_ON_PROJECT_REPOS)
    repositories {
        google()
        mavenCentral()
        maven { url = uri("https://jitpack.io") } // Add this line
    }
}
Step 6: Sync and Rebuild
Sync your project with Gradle and rebuild it. Scabbard will process your Dagger setup and generate the dependency graphs.
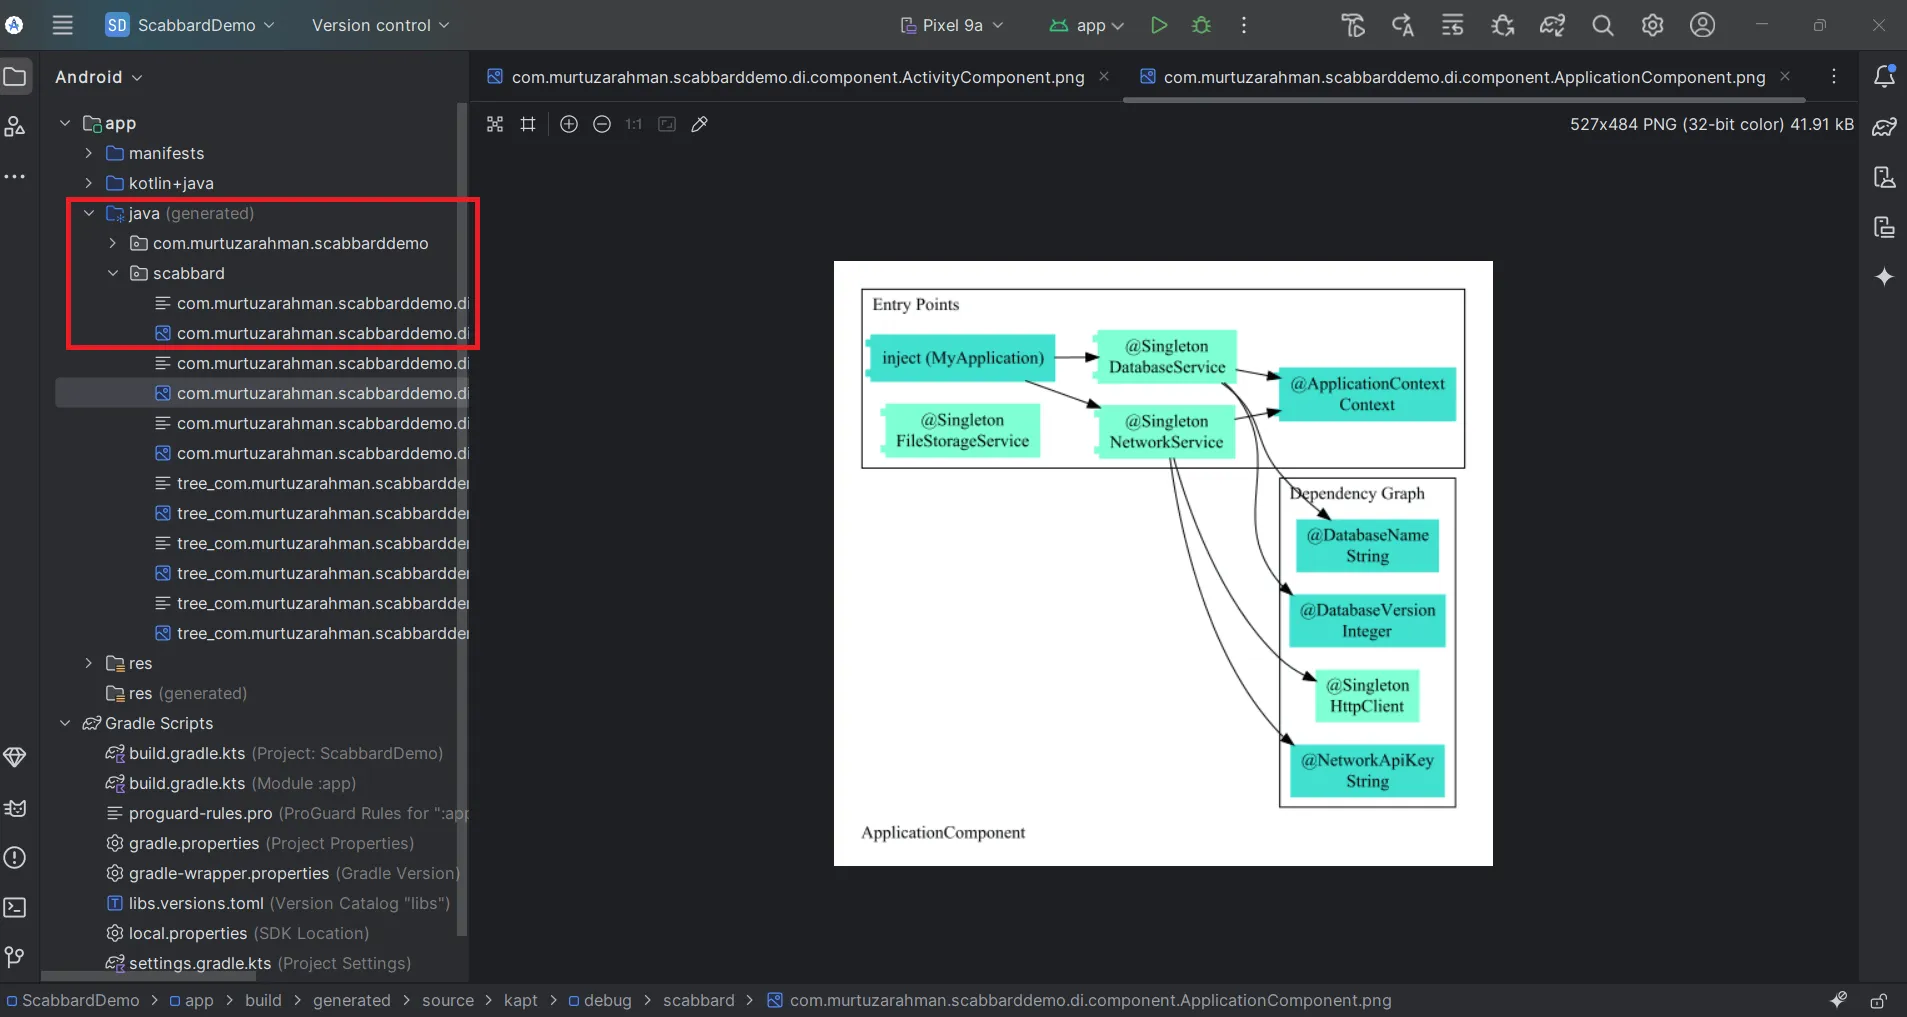
Where to Find the Dependency Graph
After a successful build, you’ll find the generated Dagger dependency graphs in the scabbard folder within your project directory. These images provide a detailed overview of how your dependencies are structured and interconnected.